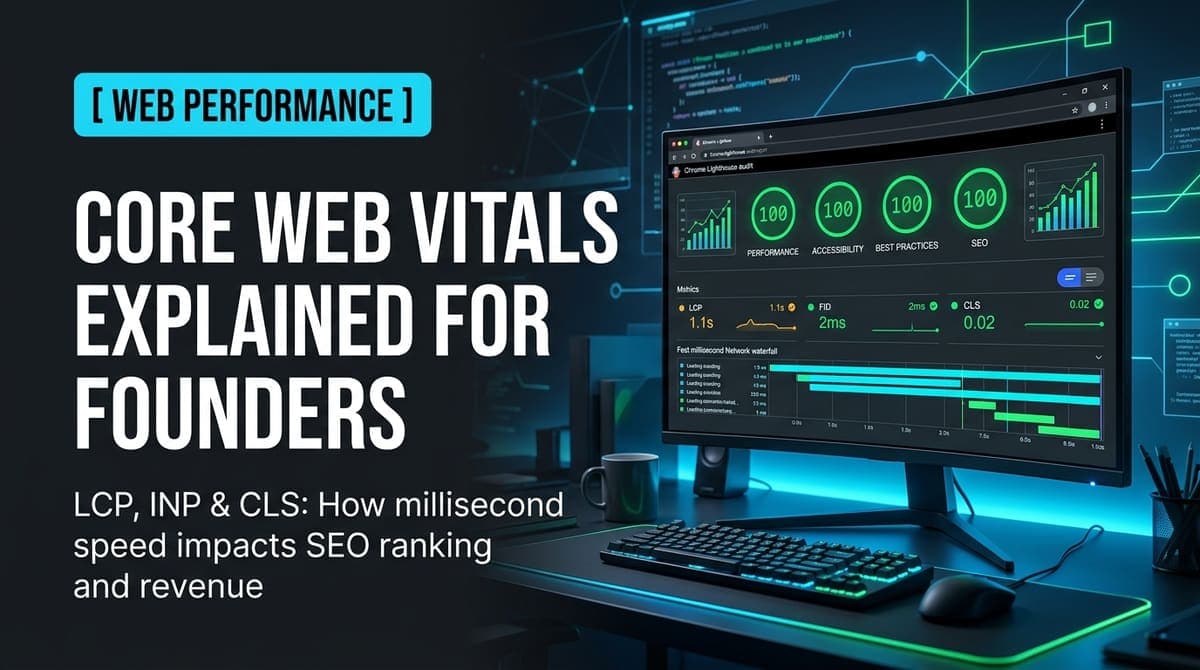
“Google doesn't just rank your content - it ranks how fast and stable that content is to experience. Core Web Vitals are the score on that second test.”
The metric every founder skips until rankings dropWhat Core Web Vitals Actually Are
Core Web Vitals are three specific performance measurements Google uses to assess user experience on your site. They were introduced in 2021 and are now a confirmed ranking signal. Ignore them and you are handing competitors an edge on every search result page you both appear on.
The three metrics are Largest Contentful Paint (LCP), Interaction to Next Paint (INP), and Cumulative Layout Shift (CLS). Each measures something different - loading speed, responsiveness, and visual stability respectively. All three are measured in the real world using data from Chrome users visiting your site, not synthetic lab tests.
That last point matters more than most founders realise. Your score is based on actual visitor sessions aggregated over 28 days. A blazing-fast office connection in Mumbai will not rescue you from slow load times experienced by a user on a 4G connection in Pune.
LCP: How Fast Your Page Feels to Load
Largest Contentful Paint measures how long it takes for the biggest visible element on the screen - usually a hero image, a large heading, or a banner - to fully render. Google considers anything under 2.5 seconds good, 2.5 to 4 seconds needs improvement, and over 4 seconds poor.
The most common LCP killers are uncompressed images served without a CDN, render-blocking JavaScript loaded before the page can paint, and slow server response times. A 4MB hero image served from a single-region server is enough to push most sites into the 'poor' band on mobile.
Fixing LCP nearly always involves a combination of image optimisation (WebP format, correct sizing, lazy loading for off-screen images), a content delivery network, and moving third-party scripts to load after the main content. It is fixable but it requires touching your build pipeline, not just a plugin setting.
INP: How Responsive Your Page Feels
Interaction to Next Paint replaced First Input Delay in 2024 and it is the harder metric to pass. INP measures the time between a user's interaction - a click, tap, or key press - and the moment the browser visibly responds. Google's threshold for a 'good' score is under 200 milliseconds.
A slow INP makes your site feel sluggish even if it loads fast. The user clicks a button and nothing appears to happen for half a second. They click again. Now the action fires twice. This is a common failure mode for React and Next.js sites that run heavy JavaScript on the main thread.
The root causes are usually JavaScript bundles that are too large, event handlers that trigger expensive recalculations, and third-party scripts running at inopportune moments. Diagnosing poor INP requires browser profiling tools - it is not visible by just looking at the page.
CLS: Why Your Page Jumps Around
Cumulative Layout Shift measures visual stability - specifically, how much the elements on your page move unexpectedly while the page loads. You've experienced poor CLS when you go to click a button and an image loads above it, pushing the button down just before your finger lands. You've now clicked the wrong thing.
CLS is scored on a scale where 0.1 or below is good, 0.1 to 0.25 needs improvement, and above 0.25 is poor. Scores above 0.1 are extremely common on newly launched sites because most developers don't reserve space for images and embeds during build. The fix is straightforward in principle - always define explicit width and height on images and iframes - but it has to be done across every template and component.
Font swaps are another silent CLS contributor. When a custom font loads and replaces the fallback system font, if the two fonts have different metrics, every line of text can shift by several pixels. Setting font-display: optional or carefully matching fallback fonts eliminates most of this.
How to Check Your Current Scores
Google PageSpeed Insights (pagespeed.web.dev) gives you a free breakdown of all three metrics for any URL. Enter your homepage, your highest-traffic landing page, and your most important product page separately - scores vary significantly between pages. The tool shows your real-world Field Data if your site has enough Chrome traffic, plus a lab-based simulation.
- PageSpeed Insights: free, page-by-page, real field data if available
- Google Search Console: Core Web Vitals report shows which URLs are failing across your whole site
- Lighthouse in Chrome DevTools: lab test only, useful for development but not your actual score
- web-vitals JavaScript library: embed it to log real user scores to your own analytics
The Search Console report is the most actionable for a founder because it groups failing URLs and tells you the volume of poor experiences. If your homepage is in the 'poor' bucket with thousands of impressions, that is a conversion and ranking problem happening right now.
What Actually Moves the Needle
Most performance wins come from a short list of changes. In our experience working on site performance audits, fixing these five issues resolves the majority of Core Web Vitals failures:
- Serve images in WebP or AVIF with correct dimensions set on every img element
- Move to a CDN - Cloudflare's free tier is sufficient for most startup sites
- Defer non-critical JavaScript and remove any unused third-party scripts
- Reserve space for all images, ads, and embeds with explicit width and height attributes
- Preconnect to critical third-party origins like Google Fonts and analytics endpoints
These are not difficult changes individually. The challenge is that they require auditing every component, every template, and every page type - and then making sure the fixes survive future deploys. A one-time fix that gets overwritten by the next feature push is not a fix.
The Hidden Cost of Ignoring This
Poor Core Web Vitals affect you in two compounding ways. The direct effect is lower search rankings - Google confirms it is a tiebreaker between pages with similar relevance signals. The indirect effect is that slow, unstable pages convert worse. A site loading in 5 seconds has 38% fewer conversions on average than one loading in 1 second, according to Google's own research.
For a founder paying for Google Ads or investing in SEO content, poor Core Web Vitals are leaking money from both ends - worse rankings mean lower organic traffic, and worse conversion rates mean fewer of the paid visitors who do arrive actually become leads.
This is the kind of audit and fix work we do at Zovintra. If your site was built quickly - whether by an agency, a no-code tool like Webflow or Framer, or a developer who prioritised features over performance - there's a good chance it has avoidable Core Web Vitals failures sitting in your Search Console right now. A performance audit takes less than a week and the improvements are measurable within the next data cycle.